Knowing how to interpret side imaging sonar opens doors for anglers, inshore or not. Learn how to unlock this powerful tool.
Interpret Side Imaging Sonar
There have been many game-changing innovations for inshore anglers, like the Power Pole shallow water anchor and Minn Kota's Ulterra trolling motor.
However, there is another one that goes largely unnoticed and, as a result, is hardly used by inshore anglers.
That innovation is known as side imaging sonar and it's over ten years old!
Why is it such a big deal?
Because it does two things:
- More accurately shows us what's underwater
- Covers a wider area
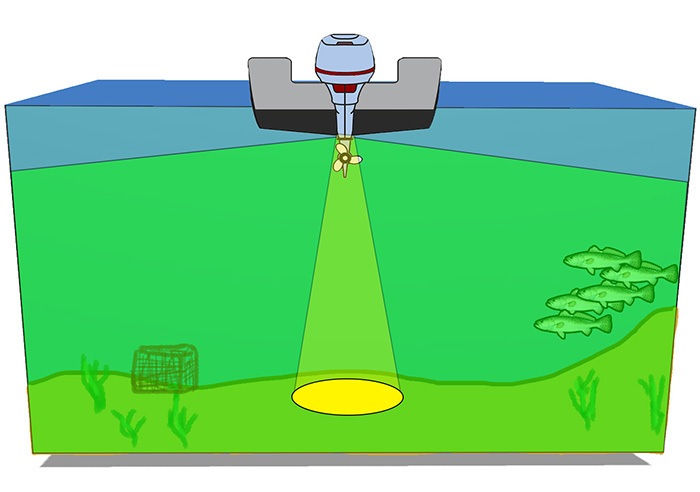
Take a look at the graphic below.
The yellow cone represents conventional "2D" sonar and it's plain to see that it doesn't detect much.
In fact, it's missing the crab trap to the left and the school of speckled trout to the right.

But side imaging sonar scans up to 360 feet to each side of the boat, which is depicted by the green band stretching across the entire graphic.
The crab trap and speckled trout cannot escape detection!
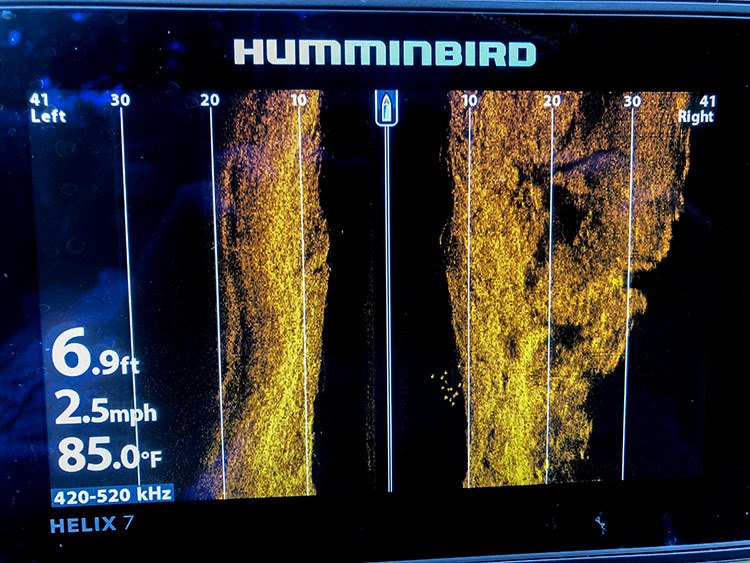
When side imaging is rendered on your graph (or fish finder or whatever you call it) it looks like this:

Do you know exactly what's represented in this picture?
It can be difficult to make heads or tails of what's going on, so let's break it down!
Breaking it Down "Barney Style"
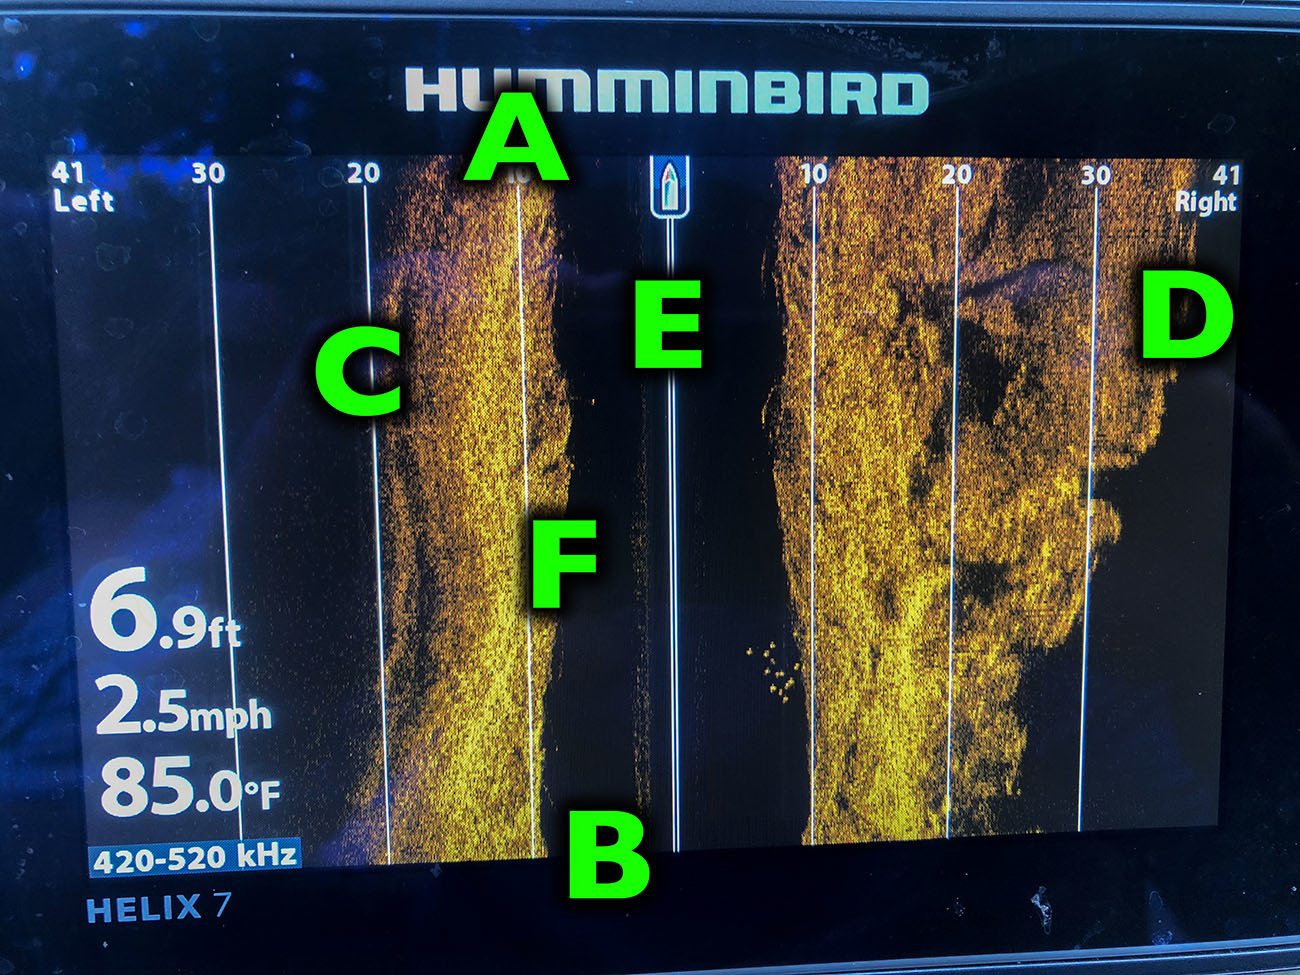
I labeled the picture to identify what's what for you.

A
This is where the most recent sonar image is.
It is what just passed under the transducer.
B
This is the most distant sonar history, whatever was scanned roughly a minute or so ago.
C
This marks the shoreline on the left (or port) side of the boat.
NOTE: I am intentionally zoomed out to show this.
D
Shoreline on the right (or starboard) side of the boat.
E
The surface of the water.
F
The seafloor directly underneath the boat.
Water Depth
The black space between the surface (represented by "E") and the bottom (indicated by "F") is the depth directly underneath your boat.
That's why it appears black.
The deeper the water, the wider the black band in the middle of the screen.
Range Indicators
The vertical lines spreading from the center of the screen indicate horizontal distance to the left and right of the boat.
You can see them marking to 10, 20 and 30 feet, all the way to the 41 feet my side imaging range is set to.
Got it?
So you can interpret side imaging sonar now. :)
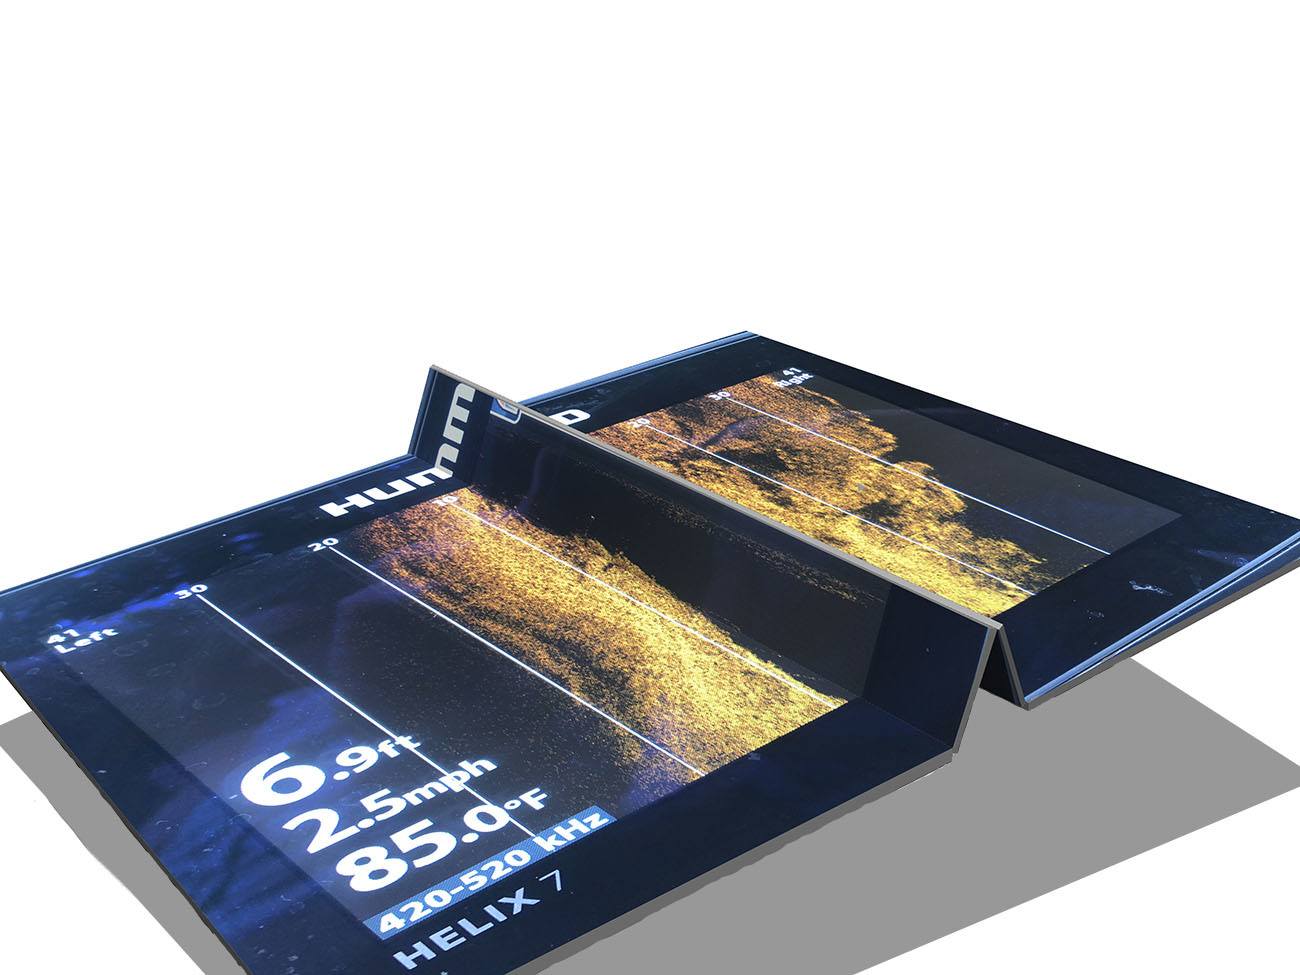
However, just to be sure, I've folded the image to give a better idea how you should visualize side images in your mind.

The middle crease is the water's surface, with the two bottom creases being where the bottom is directly under the boat.
What you see to the left and right of the middle crease represents everything to the left and right of the boat.
Pretty simple, huh?
Want to learn more?
Then check out these seminars:
Sonar is a great tool, especially side imaging, and it's something I go into detail about inside LAFB Elite.
Conclusion
Knowing how to interpret side imaging sonar enables inshore anglers to unlock fishing opportunities they otherwise wouldn't have.
If any of this is still confusing, or if you feel there is a better way I can explain it, then please say so in the comments below.
Tight lines, y'all!

Hey Harold, hope you’ve been well! You’ve always posted awesome reports inside Louisiana Troutmen. Very glad to see you here.
I understand what you’re saying but this is not a complete course, it’s only a guide to gain a basic understanding of how to interpret side imaging sonar and is not factoring in depth.
That’s probably what Roy is referring to and Technological Angler goes into deeper detail here:
https://www.technologicalangler.com/understand-side-imaging-range
That and the graph depicted here is a Humminbird, not Lowrance.
Again, the interpretation being communicated here is a basic one and not an advanced one.
In my courses, lessons upon lessons are used to go into detail. Can’t really do that here.
Anyway, there’s no need to do the math to figure an object’s actual distance. The graph does that for you when you drop a waypoint on it.
This is why I have a graph on the bow, and GPS mounted above the transducer (more accurate fix than at the bow or console) and how I’m able to mark offshore structure ( humps, ledges, etc.) and cast directly to them.
I’ve done this to catch bass in deeper water, usually offshore with crankbaits, and sometimes with speckled trout and redfish, but not nearly as often (just not necessary).
Or use the old school method and toss a buoy. lol
Anyway, just wanted to clear that up.
Thanks for commenting, Harold. I’m glad you took the time to turn us on to Roy’s resource.
I’m currently taking training course via ZOOM. It’s conducted by an IT guy who is also on Lowrance’s pro staff. He has a THOROUGH working knowledge of all sonar units. My first question to him was about those numbers at the bottom of the screen. I was surprised to learn that they do NOT represent distance from the boat. Check out his site, Wacky Riggers. His name is Roy.
Hey Reece, that’s a good question and I guess I’d have to say that I use them both as much as the other.
Would you say you use SI more than 2D?
The bright, “Jedi Lightsaber” line is the surface.
The yellow line/interference you see below the top fold is prop wash, as the transducer is mounted on the starboard side.
Yes you’re right, that is the bank on the left.
In reference to the starboard side, if you mean that the bank started out at 20ft then curved to 40ft away, yes that is accurate.
That may not be the actual shape of the bank, it just means the distance between the bank and the transducer grew, whether the bank or the boat pulled away.
The dark areas within the “gold area” on the starboard side are shadows being cast by the bottom structure.
The bottom structure must be shaped like a “hill”, or “mountain”, that rises from the bottom and blocks the sonar signal from hitting anything behind it.
This is similar to an actual mountain blocking sunlight from reaching anything behind it.
Well, this certainly helps lay it out! So, the faint line at the peak of the fold, is that “prop wash”? The depth reading says 6.9 ft, and that lines up with the scale on the screen. The port side shows gold color out to about 20 ft, so that is then representative of the far bank on the left, 20 ft away? And the starboard side started at 20 ft, and is then just short of 40 ft away at the position of the boat? On the starboard side, how would you interpret the dark areas that are within the gold area?